
Case Study: Machine Learning Reveals Key Predictors of Child Mortality
We analyzed tens of thousands of machine learning models to identify the most influential factors contributing to child mortality across seven countries. This extensive process allowed us to map regional variation in key drivers of child mortality, offering detailed insights into local challenges. Our findings can be used to develop targeted interventions that address the specific needs of vulnerable populations. By integrating data science with on-the-ground health strategies, our work is directly contributing to the development of more effective, region-specific solutions to improve child survival outcomes.
Background
Reducing mortality among children under five remains a critical development objective. Although the under-5 mortality rate (U5MR) has fallen globally from 93 deaths per 1,000 live births in 1990 to 38 per 1,000 in 2019, 73 countries have not yet met the Sustainable Development Goal U5MR target of 25 per 1,000. Understanding predictors and risk factors for child mortality allows countries to develop new interventions and provide greater support for high-risk children, enabling progress towards greater child survival.
Previous analyses primarily explored child mortality predictors using frameworks based on logistic regression. Emerging machine learning techniques, which can identify nuanced relationships between predictors and an outcome from a high-dimensional feature space, present promising opportunities to enhance mortality risk prediction. However, these techniques can be difficult to interpret:
The “black box” nature of many machine learning models complicates the interpretation of feature importance from model results, particularly when comparing across different model types.
Previous studies that applied machine learning to predict child mortality often explored just one algorithm or country setting, leaving open questions about the transferability of study findings to other contexts.
In partnership with an international development agency, we evaluated the performance of eight machine learning frameworks for predicting child mortality across seven low- and middle-income countries in Africa and Southeast Asia:
We predicted the probability of mortality among children aged 1 to 59 months of age, a relatively under-studied group in the literature
We compared relative predictor importance across each country and machine learning model type using a Shapley decomposition framework
We then mapped key predictors of child mortality across the seven focus countries to better understand local challenges to improving child survival.
Our study identified novel predictors for identifying children with elevated mortality risk. It also offers broadly applicable evidence on the effectiveness of machine learning models for predicting child mortality.
Data
We pulled data on child mortality from the latest Demographic and Health Surveys conducted in seven focus countries:

Maps showing raw child mortality data by survey cluster from the most recent Demographic and Health Survey in each of seven focus countries: Senegal (2019), Cote d’Ivoire (2021), Ghana (2022), Nigeria (2018), Kenya (2022), Madagascar (2021), and the Philippines (2022). Note that the scales for sample size and mortality proportions vary by country.
We calculated child mortality from complete birth histories among children born in the 10 years preceding each survey.
For each child-age-year observation in the mortality dataset, we also derived a set of candidate predictors from survey variables and overlaid geospatial data. Ultimately, we included 57 candidate predictors across 10 themes:
Mother demographics (7 predictors)
Pregnancy services (10)
Quality of antenatal care (5)
Women’s empowerment (1)
Child demographics (5)
Sibling vaccination history (8)
Sibling anthropometry (3)
Household characteristics (4)
Geospatial indicators (14)
Model comparisons
We compared the performance of eight classification model types to predict child mortality:
Standard logistic regression, used as a baseline
Elastic net (penalized) logistic regression
Bayesian logistic regression, with priors on predictor effects
Bagged regression trees
Random forests
AdaBoost
XGBoost
Support vector machines
We ran separate predictive models for each country. Models for each country and framework were evaluated using five-fold cross-validation, based on the root mean squared error (RMSE) between model predictions and held-out observations. We also calculated the area under the receiver operating characteristics curve (AUC) on held-out observations for all models.
We found that bagged regression trees and random forests yielded the best predictions of child mortality risk.
Both models outperformed logistic regression in terms of AUC: across the seven focus countries, random forests had an average AUC of 74.6%, bagged regression trees had an average AUC of 73.1%, and logistic regression had an average AUC of 56.6% (50% = equivalent to random chance; 100% = perfect prediction). Bagged regression tree and random forest models were also better able to capture time and age cohort trends in mortality over the study period.

Out-of-sample receiver operating characteristic (ROC) curves for child mortality prediction across three models: logistic regression (pink), random forests (green), and bagged regression trees (blue). A perfect model with AUC = 1 would approach the top-left corner of each plot; curves that are closer to this corner indicate better model performance. The dotted line has AUC = 0.5, which is a model performance equivalent to random chance.

Lexis diagram showing mortality risk by child age group and year for Madagascar. Mortality risks in observed data are shown in the first plot; the other three plots show estimated risks from logistic regression, random forest, and bagged regression tree models. Out of these three models, the bagged regression tree model yields the closest match to the observed age-year pattern in Madagascar complete birth history data.
Shapley Decomposition
We also ran Shapley decompositions to identify relative feature importance across each country and model type.
The Shapley decomposition is a game-theoretic approach to assigning predictor importance. Using the Shapley decomposition, the importance score assigned to feature X can be interpreted as the average improvement in performance from adding feature X to the set of all possible models not containing that feature. This decomposition has some useful properties for evaluating feature importance:
Feature importance scores can be compared across different classes of predictive models.
The sum of all feature importance scores equals the difference in model scores between the best-scoring model and a model with no predictors.
Alternatively, the feature importance scores can be normalized to sum to one.
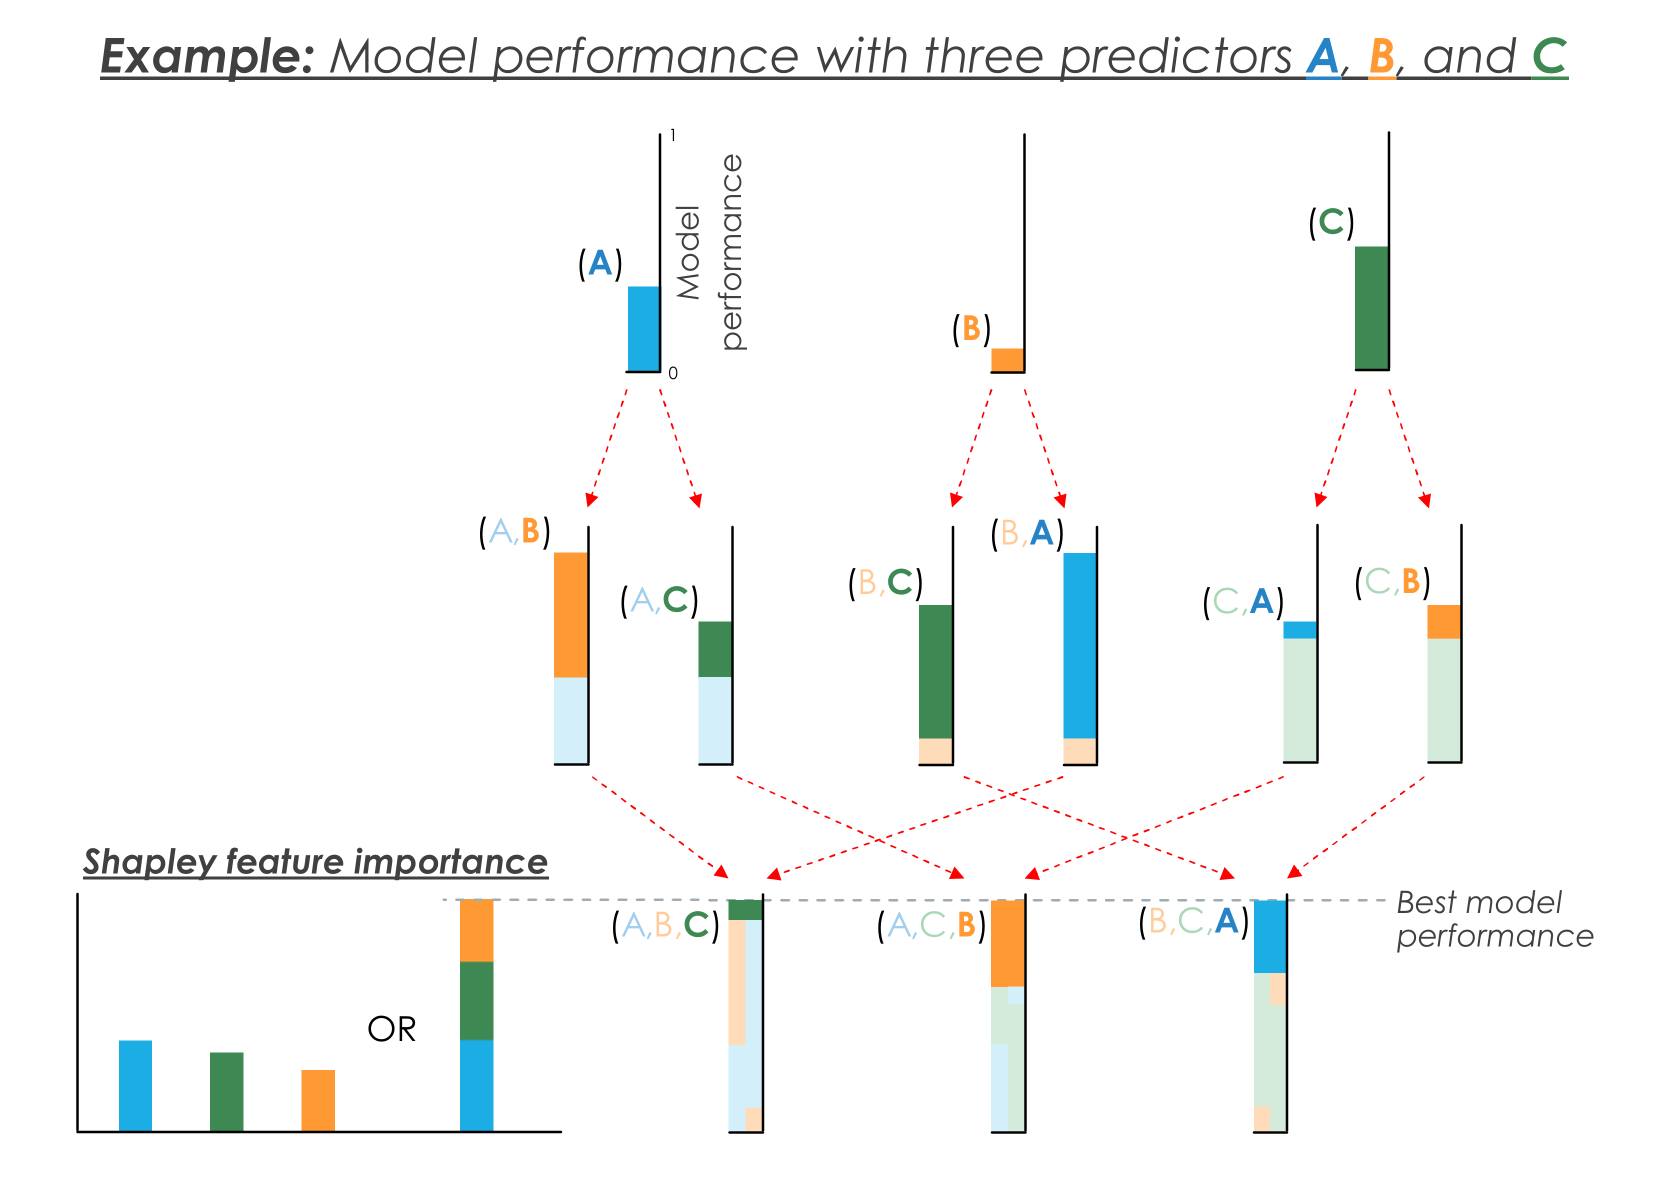
Example Shapley decomposition for a predictive model with three features A, B, and C. The Shapley importance of each feature is the average improvement to the model from adding that feature: these sum to the total improvement in performance compared to a predictive model with no features. This setup can be used with various predictive models, and the feature importance values can be compared across model types.
Calculating the full Shapley decomposition would require running 2m models, where m is the number of candidate predictors, which was impractical for a large feature space. Instead, we followed the approximation strategy first developed in the sage Python package, sampling around the feature space until importance values converged for all predictors.

Shapley relative feature importance across all focus countries, based on bagged regression tree models. Predictors are grouped into themes by hue.
The plot above shows feature importance scores for bagged regression trees, our top-performing model type. Averaged across the focus countries, the eight most influential predictors for mortality among children aged 1-59 months were: malaria incidence (7.9%); total number of children born to the mother (7.3%); household wealth index (7.0%); temperature (6.1%); child year of birth (5.9%); household size (5.4%); maternal age at birth (4.1%); and longitude, a proxy for latent location effects (3.8%).
Malaria incidence, child year of birth, household wealth index, and maternal age at birth were also included among the top eight most influential predictors for the random forest models. Geospatial indicators (shown above in purple), household characteristics (red), and maternal demographics (blue) were the three most influential themes on average.
Mapping key Predictors
To understand the context of child mortality across our focus countries, we used model-based geostatistics to generate high-resolution estimates of the top predictors identified in the Shapley analysis.
These high-resolution estimates can be used to create detailed community profiles in high-mortality hot spots; they also reveal spatial relationships between predictors that could inform multi-faceted interventions for child survival.

Model-based geostatistics to predict household wealth index across Nigeria. The raw data (top left) is used to predict many ML submodels (bottom left); these are then ensembled with a Gaussian process fit to any residual spatial variation, yielding the final estimates (center). The estimates can be aggregated to larger administrative units, such as Local Government Areas (top right), while preserving uncertainty (bottom right). Note that the household wealth index is a unitless metric that allows for negative values.

High-resolution estimates can help us to better understand relationships between key drivers of child mortality. This plot shows child stunting rates at varying levels of household wealth for detailed 5×5km grid cells across Nigeria. Note that the household wealth index is a unitless metric that allows for negative values.
Discussion
Across our seven focus countries, random forests and bagged regression trees consistently and substantially outperformed logistic regression for predicting child mortality risk. Our findings suggest that tree-based models should be gradually adapted as the standard for child mortality prediction, and risk factor analyses developed in the context of logistic regression should be extended to tree-based frameworks whenever possible.
In future research, key predictors could be used to develop “checklist” models that identify high-risk children at birth. Given the importance of geospatial predictors across countries, these findings could also be used to develop better spatial models for child mortality risk in low- and middle-income settings.
Further reading
Sharrow, D. et al. Global, regional, and national trends in under-5 mortality between 1990 and 2019 with scenario-based projections until 2030: a systematic analysis by the UN Inter-agency Group for Child Mortality Estimation. Lancet Glob Health 10, e195–e206 (2022).
Bizzego, A. et al. Predictors of Contemporary under-5 Child Mortality in Low- and Middle-Income Countries: A Machine Learning Approach. Int J Environ Res Public Health 18, 1315 (2021).
Lundberg, S. M., Lee, S.-I. A Unified Approach to Interpreting Model Predictions. in NeurIPS (2017).
Corsi, D. J., Neuman, M., Finlay, J. E. & Subramanian, S. V. Demographic and health surveys: A profile. Int J Epidemiol 41, 1602–1613 (2012).
Kuhn, M. Building Predictive Models in R Using the caret Package. J Stat Softw 28, (2008).
Covert, I. C., Lundberg, S. & Lee, S.-I. Understanding Global Feature Contributions With Additive Importance Measures. in NeurIPS (2020). doi:10.48550/arXiv.2004.00668.